
Federal Polling Aggregation!
So let's see some really, really basic polling aggregation results.
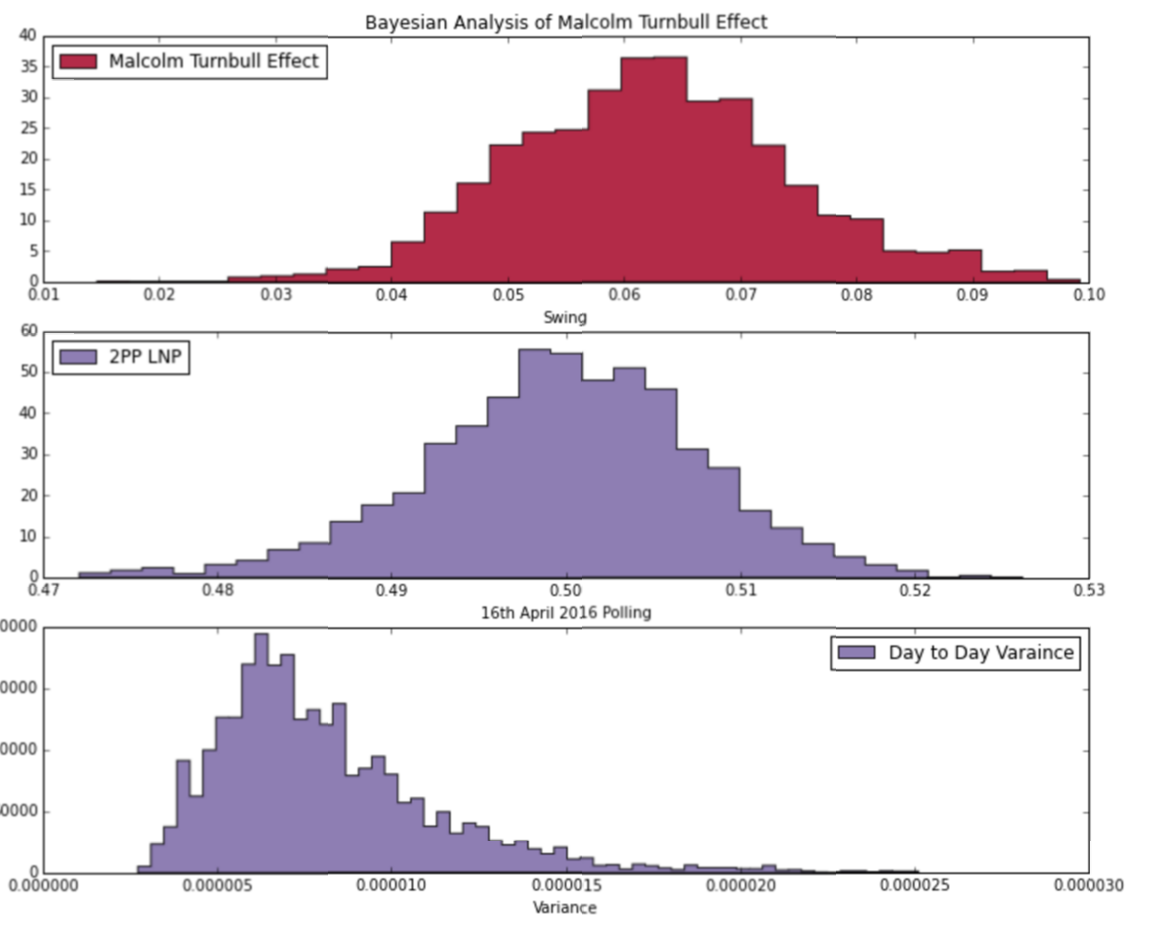
What the heck was that?
Ok so let's take a step back. How on earth have I done this? I've taken polls from multiple sources, and aggregated them using a Bayesian Heirarchical Model. I've modelled the two-party-preferred (2PP) vote of the Liberal National Coalition (LNP) on each day as a Beta distributed variable. Each day's value is modelled as a random walk from the previous day with a certain variance (the bottom graph). If you take the square-root of this value (~0.25%) that's the standard deviation of a single day!
Each of the pollsters has also been given a bit of a weighting:
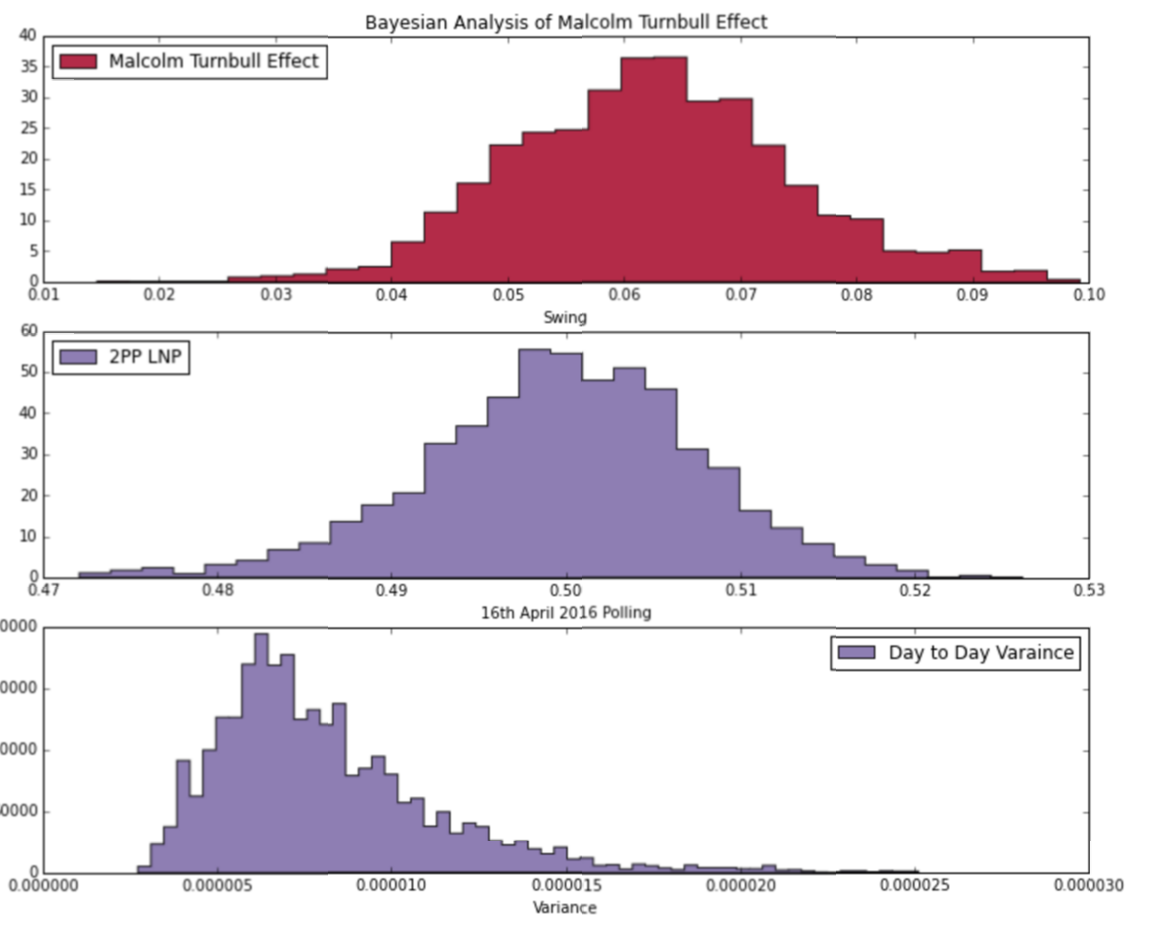
I evaluated this with a combined sum-to-zero constraint (all of the pollsters sum to zero error), as well as anchoring the 2PP value at the election as a beta distribution (a very narrow one, Beta(6908711,6006218)). This is an area that will need much refinement. Some of the polling houses have changed their methodology and sample sizes, leading to a changing bias (when compared with other pollsters). The sum-to-zero constraint is a really just a bit of a hack. What if the pollsters are all biased in the same direction, how would you know?!?
And finally, whenever leadership changes for the two major parties, I allow for a one-off step change in the 2PP. This has only happened once (since Bill Shorten took over the ALP leadership) when Malcolm Turnbull took over the Prime Ministership, and the effect of this was a polling boost of somewhere between 4% and 8%! Unfortunately for the LNP, this effect has worn off, and now we're looking at a very even 2PP, with only the remainder of the financial year to go before a presumed election.
This analysis is a first step towards a greater ever-increasing-fold goal:
- Including State Polling
- Including Seat Modelling
- Include 2PP from Primary Modelling
- More robust pollster bias evaluation
- Making everything really pretty, for the clicks
So the numbers above (while beautiful) don't really mean much (Hey, I haven't told you how many seats everyone's going to win). And if you want to see some super cool stuff, may I recommend visiting some of the links on the right (or at the bottom, you savvy mobile users, you).
Interactive Gamma-Quotient (GQD) & Division 2CP Posterior Simulator (Outputs A–E)
Live Browser Monte Carlo (N = 2,500)Adjust individual party primary shares and party-specific standard deviations (σp) below. The browser computes the exact Gamma Quotient Distribution parameters (αp, βp), simulates preference transfers, and outputs (A) 2PP Beta, (B) First-Preference GQD, (C) 2CP Matchup Probabilities, (D) Conditional 2CP Betas, and (E) Candidate Win Probabilities.
GQD(α, β):| Party | Adjust Share | Adjust SD (σp) | Simplex μp | σp | GQD αp | GQD βp |
|---|---|---|---|---|---|---|
| ALP Labor (ALP) | 31.5% | ±2.2% | 96.2 | 304.4 | ||
| LNP Coalition (LNP) | 34.5% | ±2.4% | 88.7 | 256.0 | ||
| GRN The Greens (GRN) | 14.5% | ±1.8% | 47.4 | 326.2 | ||
| IND Independent / Teal | 12.5% | ±2.6% | 17.7 | 140.6 | ||
| ONP One Nation (ONP) | 7.0% | ±1.4% | 21.6 | 307.9 |
Output (A) — Classic 2PP Beta (ALP vs LNP)
θ2PP ~ Beta(169.0, 153.5)
Outputs (C) & (D) — 2CP Matchup Probabilities & Conditional Betas
| Final-Two Pair | Matchup Prob (C) | Conditional Beta(a, b) (D) | Cand 1 Mean | P(Win1 | Pair) |
|---|---|---|---|---|
| ALP vs LNP | 100.0% | Beta(142.8, 121.0) | 54.1% | 93.0% |